
Plate 8 of W. E. B. Du Bois’s Data Portraits: Visualizing Black America presents two multi-coloured maps illustrating the migration patterns of African Americans in 1890 (Edward et al., 2018:64–65). The state of Georgia is highlighted in black to emphasise its central role, while other states display numerical data tracking movement.
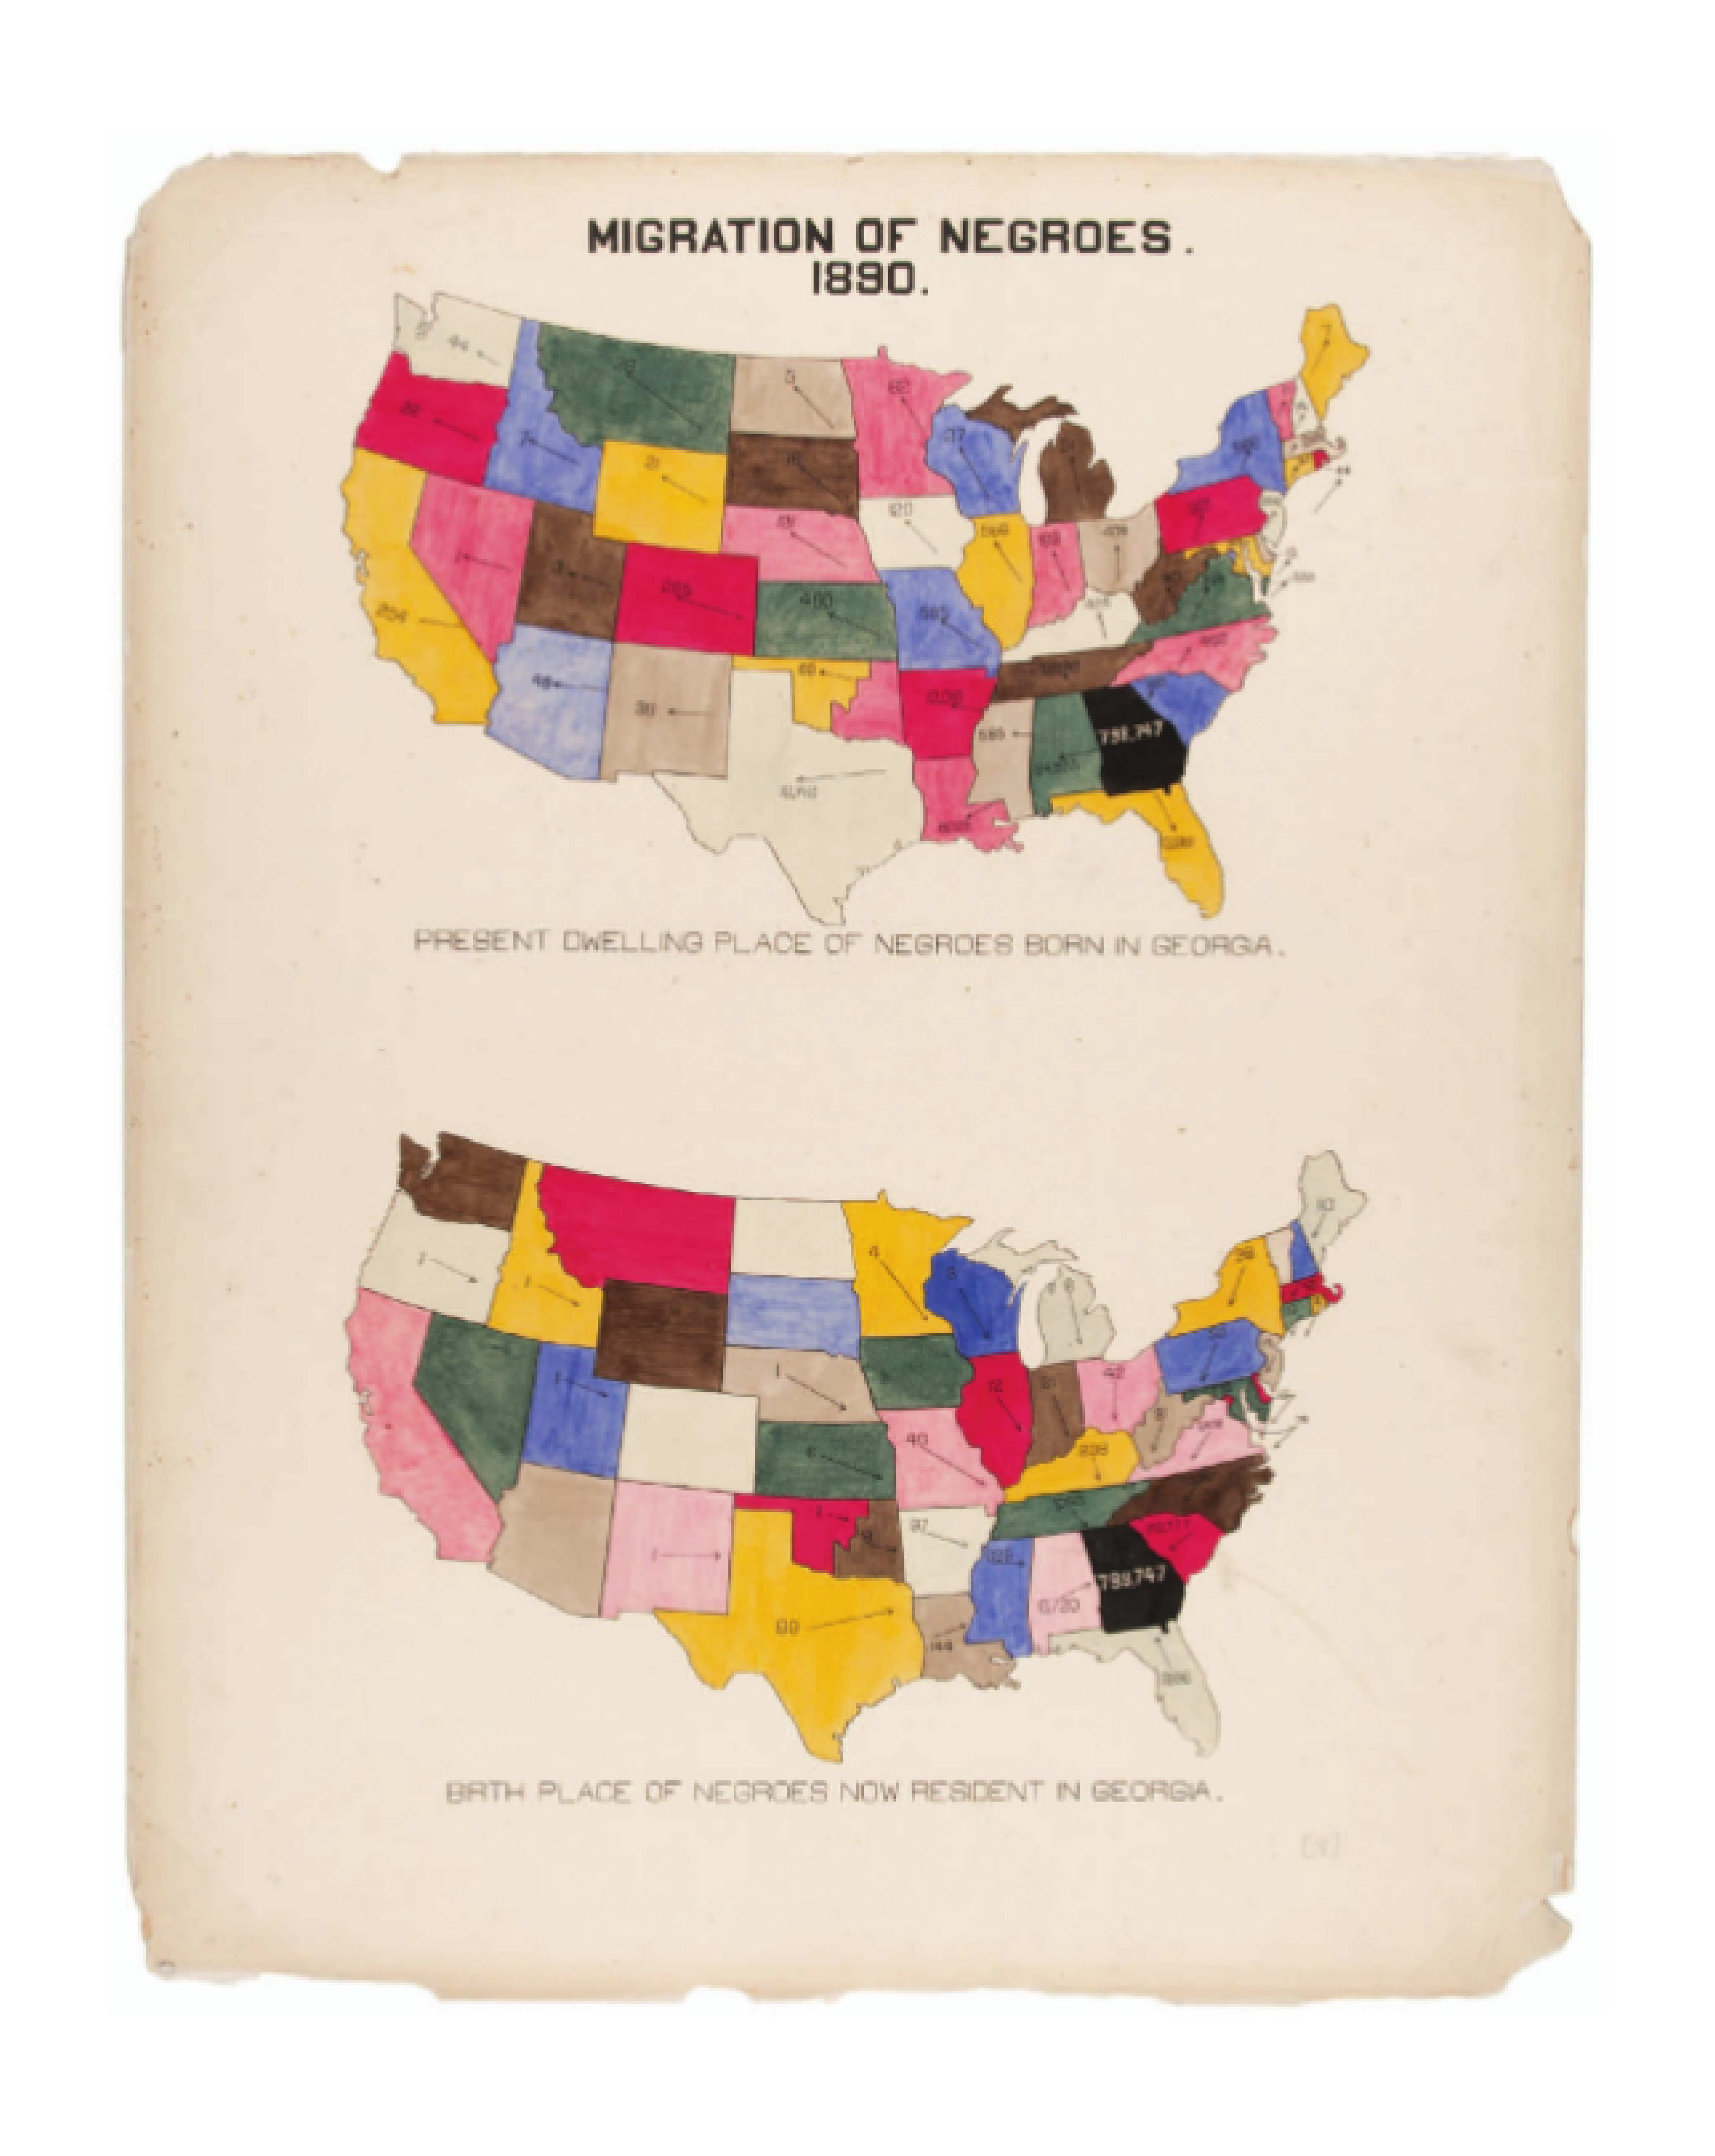
These data visualisations use colour, typography, and statistical overlays to communicate demographic shifts, particularly in response to systemic racism and economic opportunity (Edward et al., 2018:64–65). This connects to work in a digital world by showing how data visualisation remains a powerful tool for representing labour trends, migration, and inequality. Just as Du Bois’s work used emerging methods to map Black labour and mobility, today’s digital tools—such as AI, big data, and online platforms—shape our understanding of work, movement, and economic participation in real time.
Graph
Initially, I attempted to visualise the Excel spreadsheet data using Python’s Matplotlib (Matplotlib, 2012), but I encountered difficulties in getting it to work. Instead, I used Google Charts (Charts, n.d.) with HTML and JavaScript in Visual Studio Code (Microsoft, 2024) to create a bar chart.
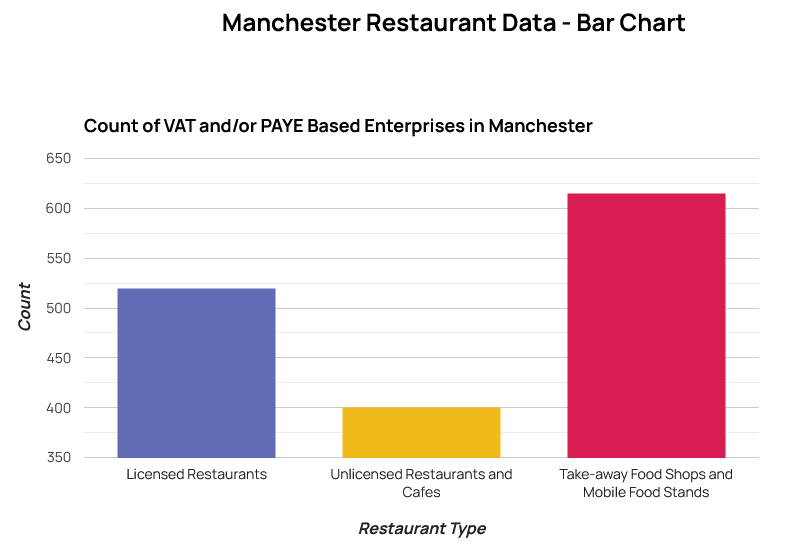
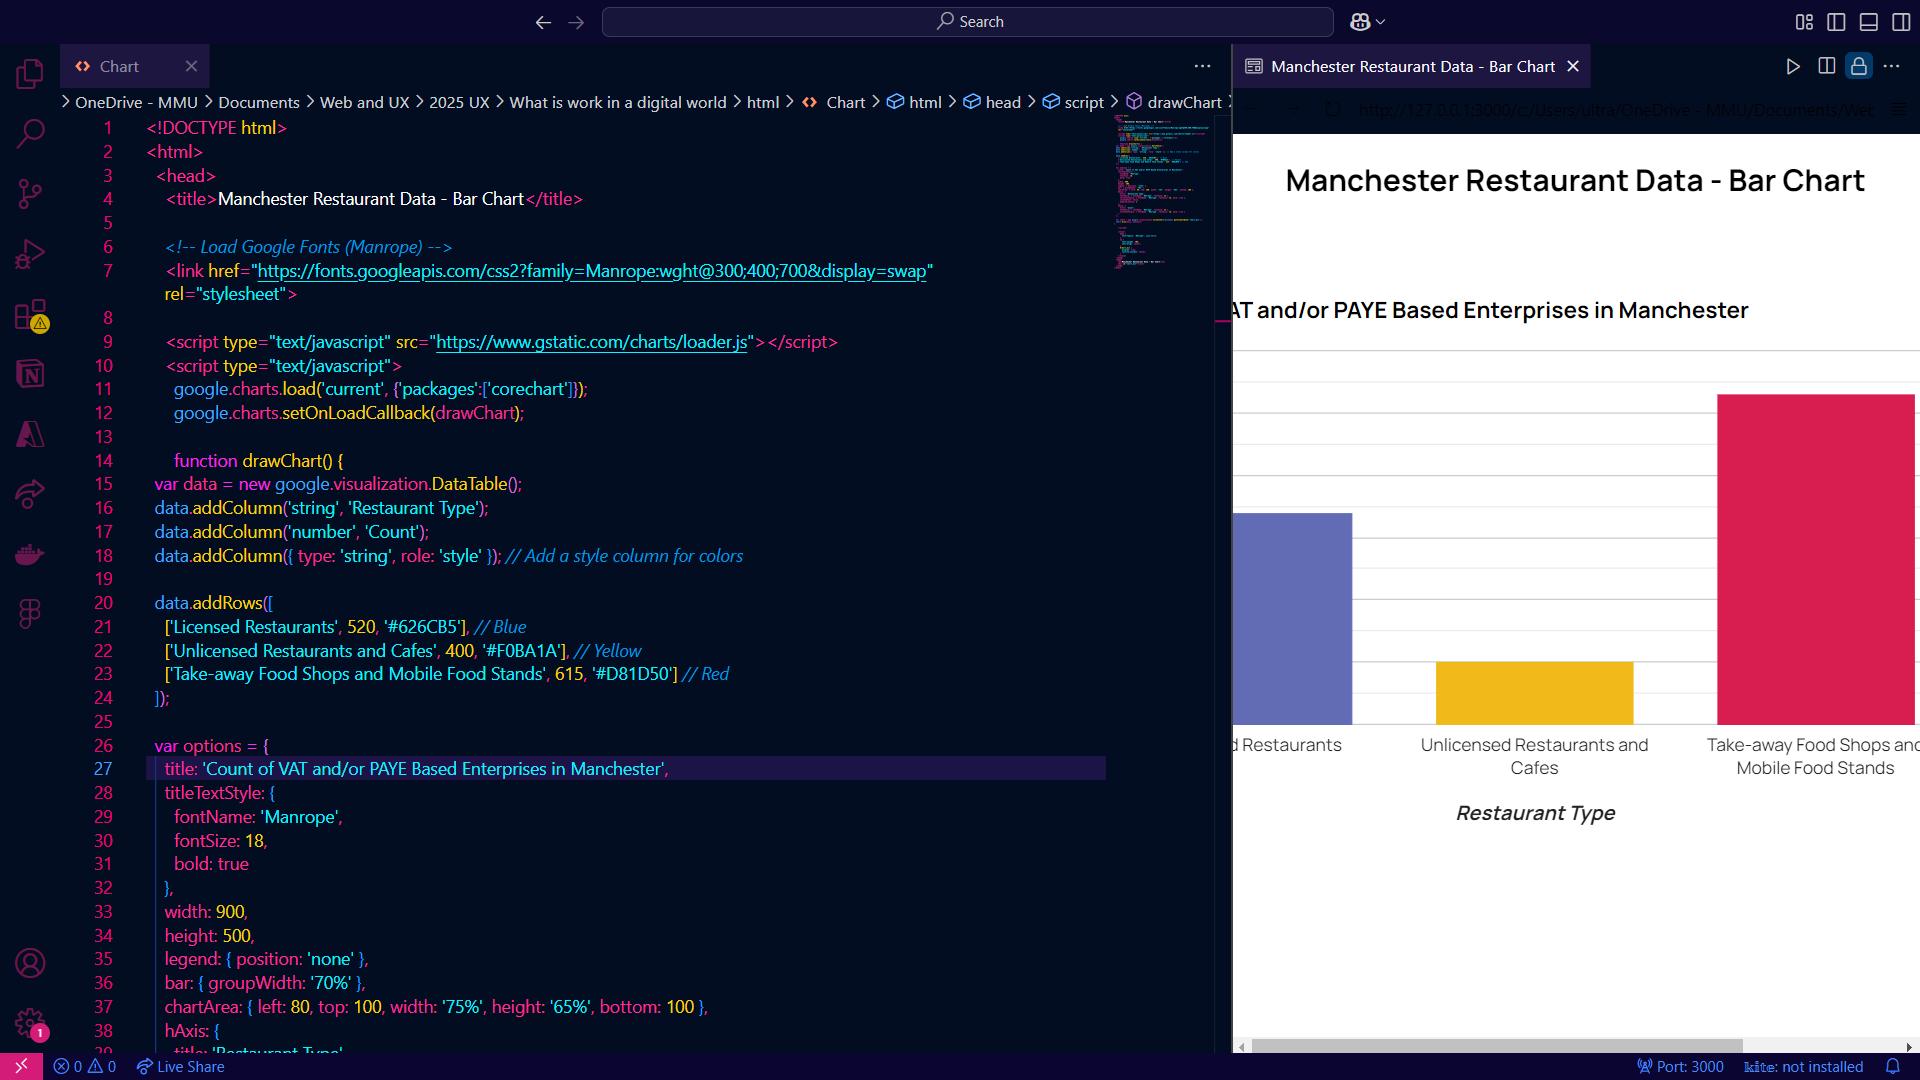
Like W. E. B. Du Bois’s data portraits, which transformed complex data into clear, compelling visuals, this graph highlights key statistical insights in an accessible way (Edward et al., 2018). His work demonstrated the power of data visualisation in storytelling, much like how modern digital tools enhance communication. ChatGPT (OpenAI, 2025) assisted me in refining the code, adjusting fonts, colors, and formatting, showing AI’s role in digital work.
References:
Photo of a computer coding screengrab by Markus Spiske on Unsplash.
Edward, W., Battle-Baptiste, W. and Rusert, B. (2018) W. E. B. Du Bois’s data portraits : visualizing Black America : the color line at the turn of the twentieth century. Amherst: The W.E.B. Du Bois Center At The University Of Massachusetts Amherst ; Hudson, pp. 64–65.
Google (n.d.) Quick Start | Charts. Google Developers. [Online] https://developers.google.com/chart/interactive/docs/quick_start.
Matplotlib (2012) Matplotlib: Python plotting — Matplotlib 3.1.1 documentation. Matplotlib.org. [Online] https://matplotlib.org/.
Microsoft (2024) Visual Studio Code. Visualstudio.com. Microsoft. [Online] https://code.visualstudio.com/.
OpenAI (2025) ChatGPT. ChatGPT. OpenAI. [Online] https://chatgpt.com/.